Base Reactions in MecaWind

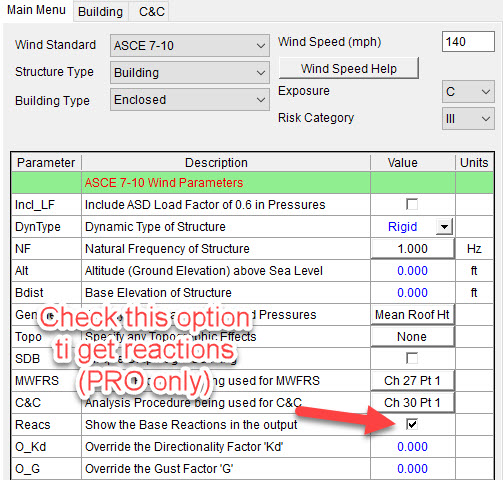
There can be confusion from users on how to read and interpret the MecaWind Base Reactions that are provided by the MecaWind software program. There is a lot of data presented, and it can become overwhelming. This article is intended to help explain how MecaWind calculates base reactions and how to interpret the results. I should clarify that this is an option that is ONLY available in the Pro version of MecaWind.
Base Reactions Example Problem:
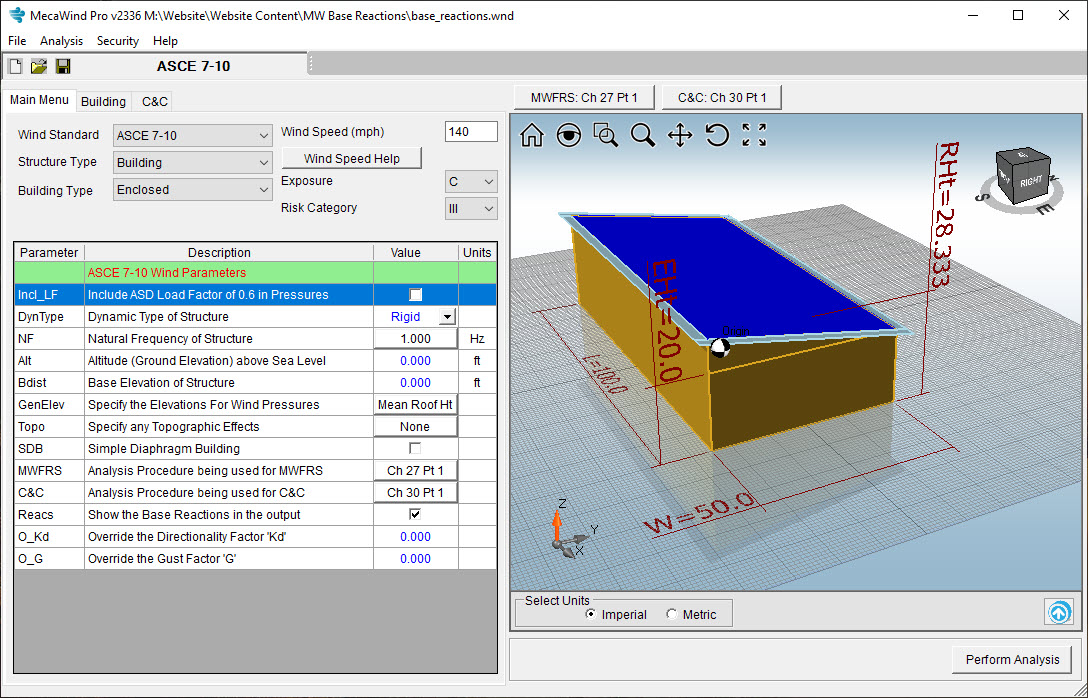
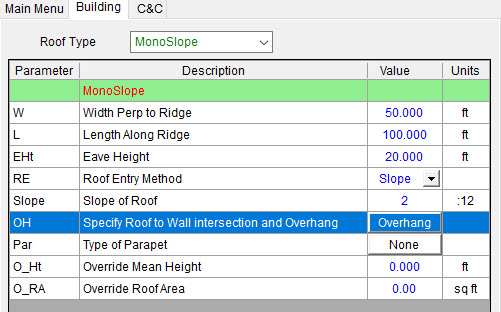
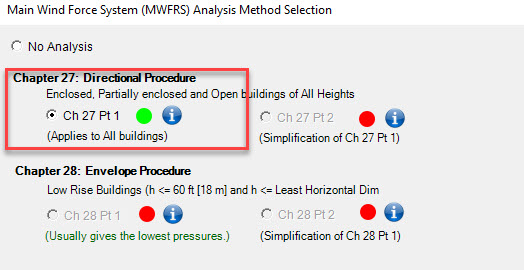
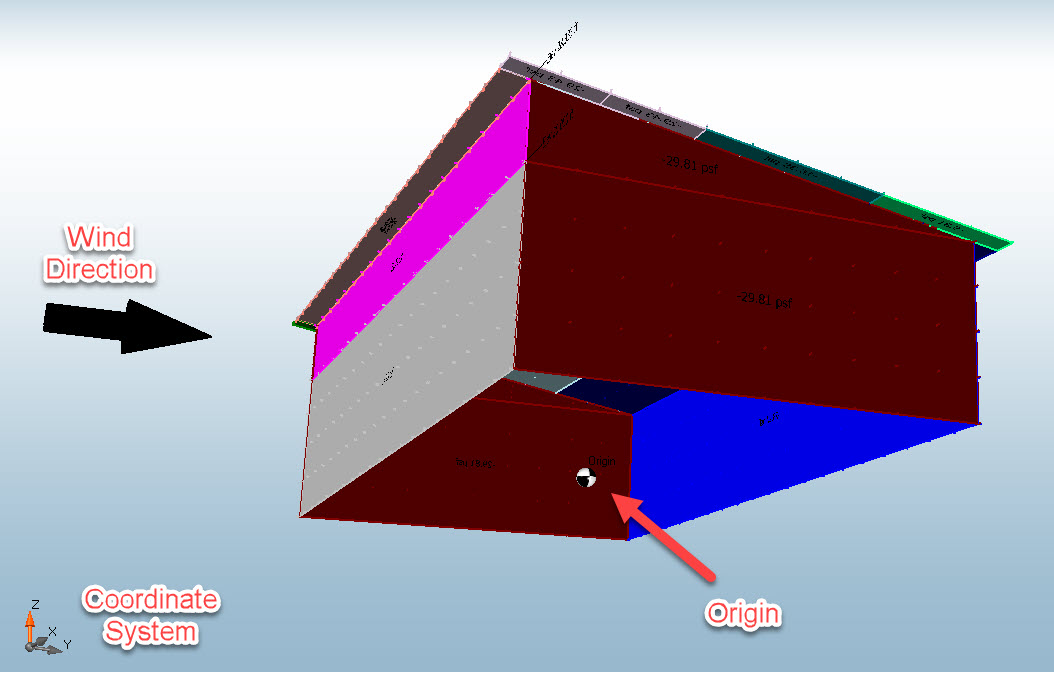
Coordinate System and Origin:
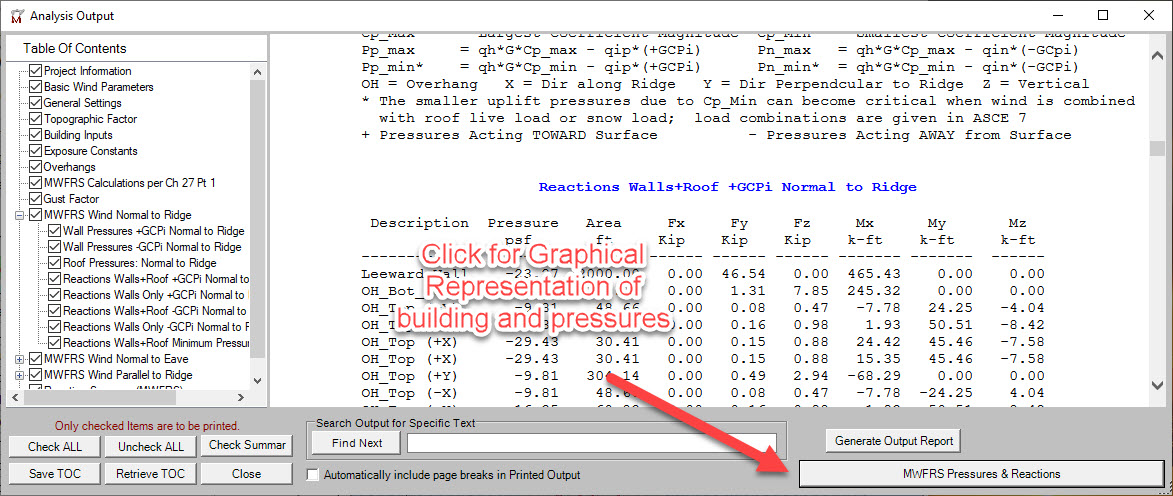
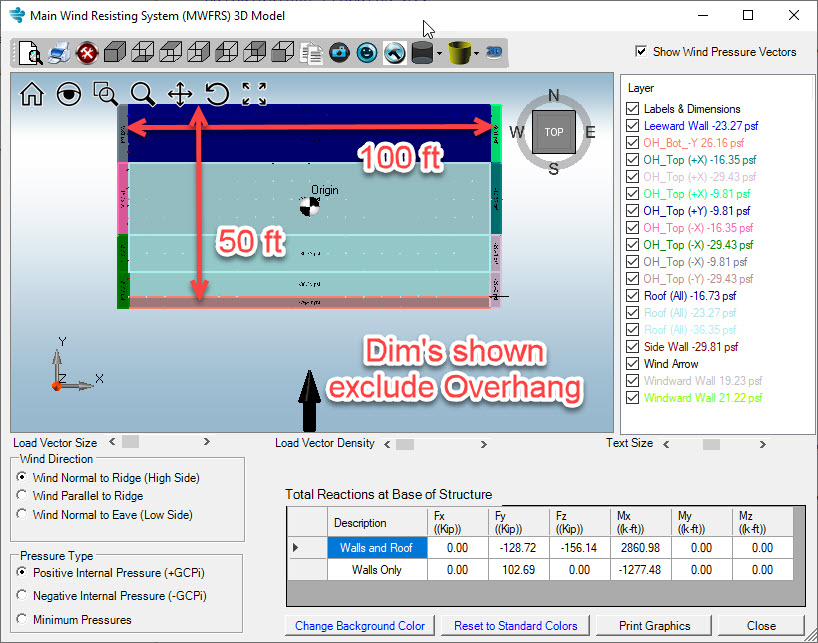
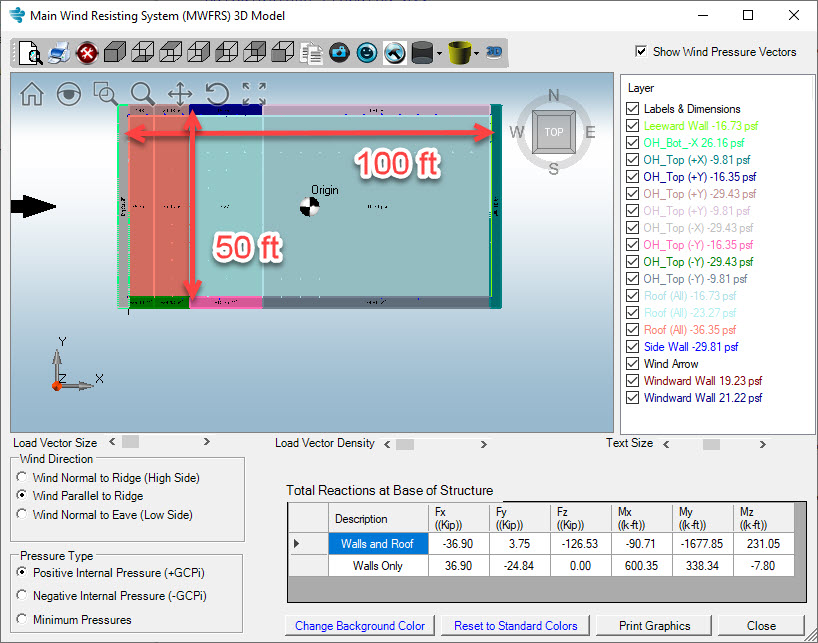
The best place to start with base reactions is to explain the basic coordinate system as well as the origin of the building. Since most of the shapes modeled in MecaWind are symmetrical, such as in a rectangular building, the origin is at the bottom of the building at the geometric center of the shape. Below is an illustration of our origin and the coordinate system. You can see this same graphic on any structure you model, by clicking the option button shown below after performing an analysis.
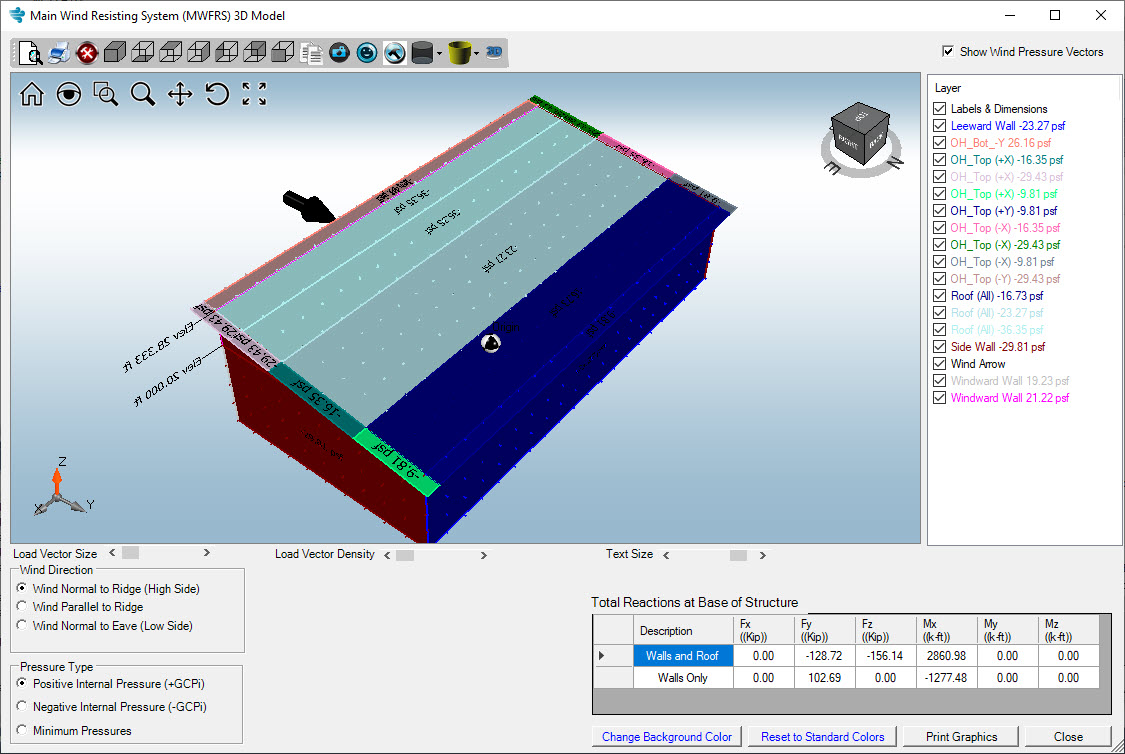
Interpreting the MWFRS Graphic:
Wind Direction:

Pressure Type:
In a building we have to consider internal pressure on the building and address the case where the internal pressure is positive (+GCPi) and then also when the pressure is negative (-GCPi). The internal pressure does not create any net forces on the building, since it is equally applied in all directions; however, it does change the individual pressures considered on any given surface.
We also have a “Minimum Pressures” option, which applies the minimum values that are required by ASCE 7 to be considered on any surface. In some low wind regions, these minimums may be the controlling wind load on the building.

How to Interpret the Pressures:
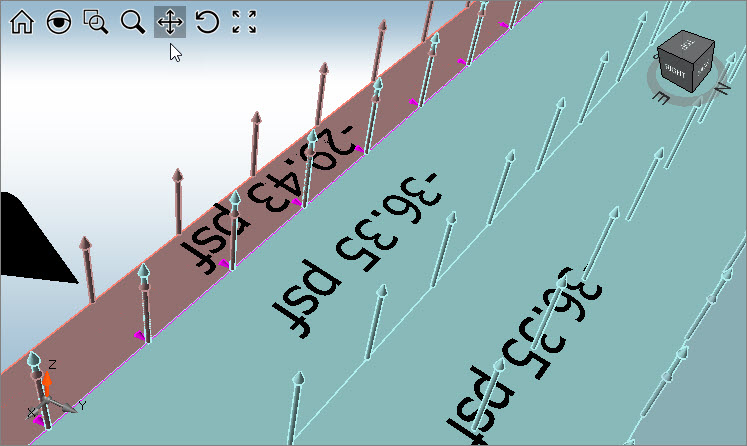
The building is broken up into a series of shapes of different colors. Each color represents a different unique surface. For example, the corresponding image shows a close-up of a roof section. The pressure sign convention is that any positive pressure is acting TOWARD the surface (if you were standing outside of the structure looking into the structure), and negative pressures are acting AWAY from the surface. MecaWind takes the guess work out by showing vectors which point the direction the pressure is acting. In this screen shot, all of the pressures are acting upward (since roof is sloped it’s not purely +Z, but also acting in the +Z and +Y direction).
Change is Good:
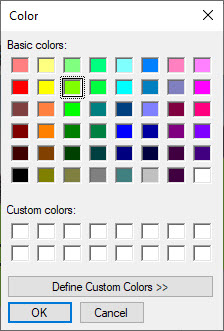
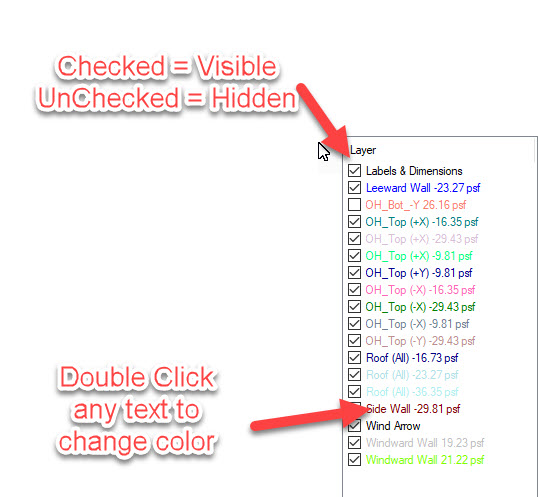
The graphic can get very cluttered and hard to see. You may want to turn off certain surfaces to make it easier to read. To do this just uncheck any box that you want to hide. Also, maybe the color doesn’t match your calculator and so you can change that as well by double clicking an entry and changing it to another color.
Convert Pressure to Force:
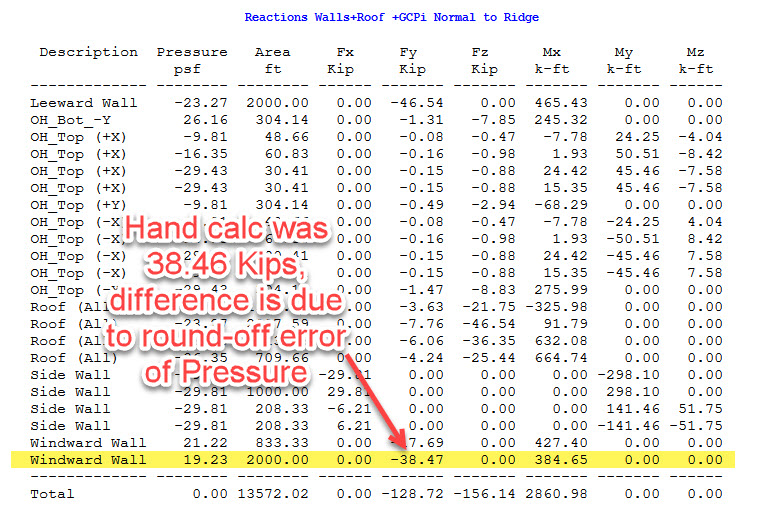
Each surface has a pressure applied to it, as we demonstrated above. If you take the pressure of each surface and multiply it by the area of that surface, then you get a force which is applied at the center of that surface. For example, if we take one surface (see corresponding image of graphic), we see that we have a 19.23 psf pressure. If we took that pressure and multiplied it by the area of that surface, then we would get a force. That force would be applied at the geometric center of that surface and would be part of the base reactions.
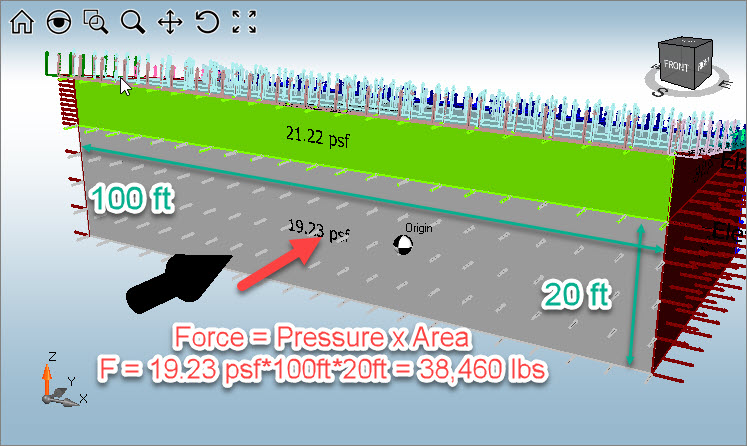
Now, lets look at the actual MecaWind Output to find the entry that corresponds to this surface. Looking at the graphic we know that the surface is the windward wall and the pressure is 19.23 psf. Looking at the output that must be the last entry of the table. The height of that surface is 20 ft and the length of the building is 100 ft, and so that agrees with the area of 20’x100′ = 2000 sq ft that is shown. The force also agrees, with a slight difference from our hand calculation. This is most likely due to round off error of the pressure, since we are only displaying 2 significant digits for pressure. The force is applied in the Y direction, and so Fx and Fz are correctly shown as zero. Since the force is applied to the geometric center of the surface, we can calculate the moment as a base reaction as follows:
Mx = 38.47 kips * 10 ft = 384.7 K-ft
Total Base Reactions:
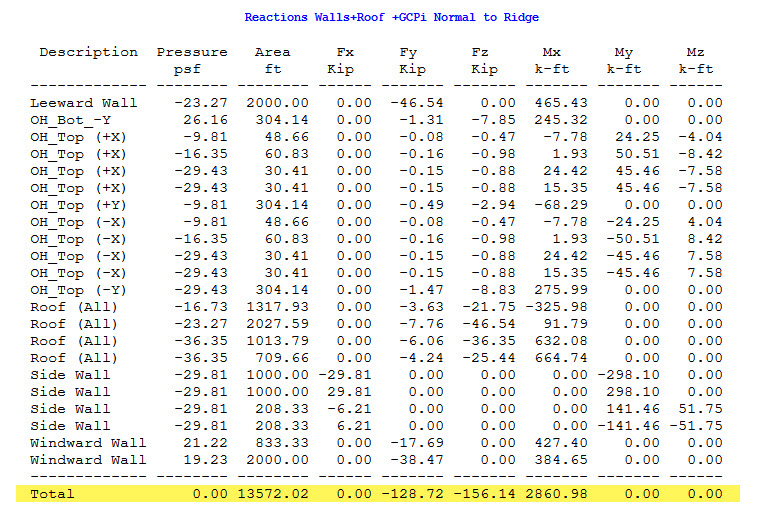
The process just described is the same process that MecaWind goes through for every surface of the building. For each surface, the following is performed:
1) Equivalent Force calculated using: Force = Pressure x Area
2) That force is assumed to apply at the geometric center of the surface and perpendicular to that surface.
3) The resulting Forces and Moments for that force are calculated about the origin of the building.
4) The Forces and Moments are totaled for all surfaces and summarized.
The results of this process and summation are shown on the MWFRS Graphics screen, as well as the MecaWind output. It is performed for each Wind Direction and each Pressure Type.
Please note that these are the “Reactions” on the base, which are equal and opposite sign of the forces that are applied to the base.

Naming Conventions:
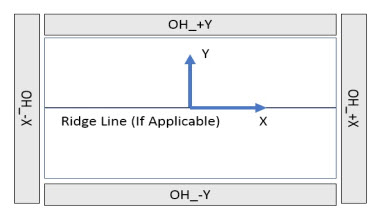
Depending upon the building, the “Descriptions” can be a bit difficult to decipher in the base reactions table above. Just remember that each line in that table corresponds to a surface on the model. Some are self-explanatory, such as “Windward Wall”, “Side Wall”, etc.. The roof pressures change along the length/width of the roof, and so it becomes challenging to find a unique label for each surface while using as few words as possible (to keep the table fitting on the page). We try to use +X, -X, +Y, -Y, etc., when possible. It is describing the surface using the origin and the coordinate system. For example, the overhangs (abbreviated as OH) in the example above are referring to the layout in the corresponding diagram. For some roofs, this same type of convention is adopted, where the X/Y refer to the quadrant where the surface is located.
Wall Uplift:
If you wanted to calculate the uplift due to wind on a given wall, you can do so by using the base reactions provided.
For example, here is the uplift on one of the 100 ft walls:
Uplift = 2860.98 K-ft / 50 ft = 57.22 Kips or 57,220 lbs
Similarly, if we wanted to calculate the uplift on the 50 ft walls we would do so as follows:
Uplift_50 ft = 1720 K-ft / 100 ft = 17.2 Kips or 17,200 lbs
It’s worth mentioning that due to the way the pressures are applied to the roof and overhang in this example, it creates some moment about the X and Z direction. The Mx does create a small amount of uplift on the 100 ft wall:
Uplift_100ft = 90.71 k-ft / 50 ft = 1.81 Kips or 1,810 lbs
The Mz moment is basically a torsion on the building, and it is generated due to the unbalanced pressures that are acting on the various surfaces. We aren’t building designers and we don’t know if you need to do anything with this Mz value; however, we just point it out because some users question why it is not zero.
Base Reaction Summary:
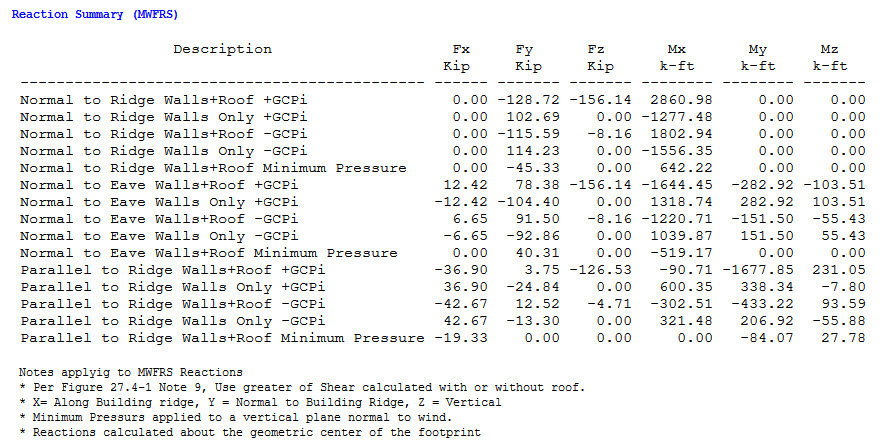
The reaction tables can be quite long and cumbersome to read. We provide them because we want the user to have all of the details that were used to determine these loads, if needed; however, most of the time they are not needed and you can select to display only the Reaction Summary at the very end of the analysis. You do this by checking or unchecking the appropriate entries in the Table of Contents.
