One Click Components & Cladding

Would you like to be able to calculate all of your Components & Cladding (C&C) values with one Click? In this article that’s what we are going to show you.
Component and Cladding Summary:
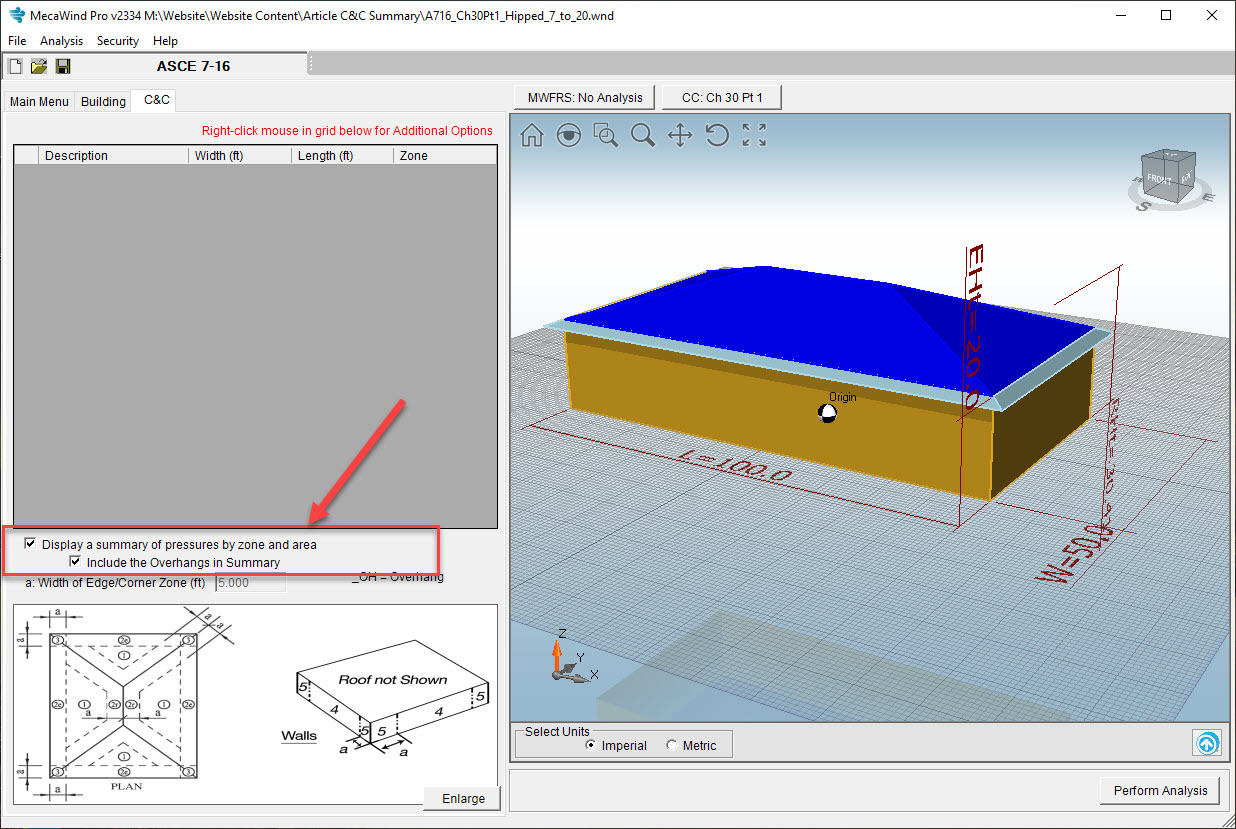
What does this option Do?
What it does is summarize all of the pressures for components and cladding (C&C) over all applicable zones and areas. As an example, lets look at a building which demonstrates this feature:
ASCE 7-16, 150 mph, Exp. C, Cat. III
Enclosed Building w/ Hipped Roof (Slope=18.4 Deg)
Width = 50 ft, Length = 100 ft
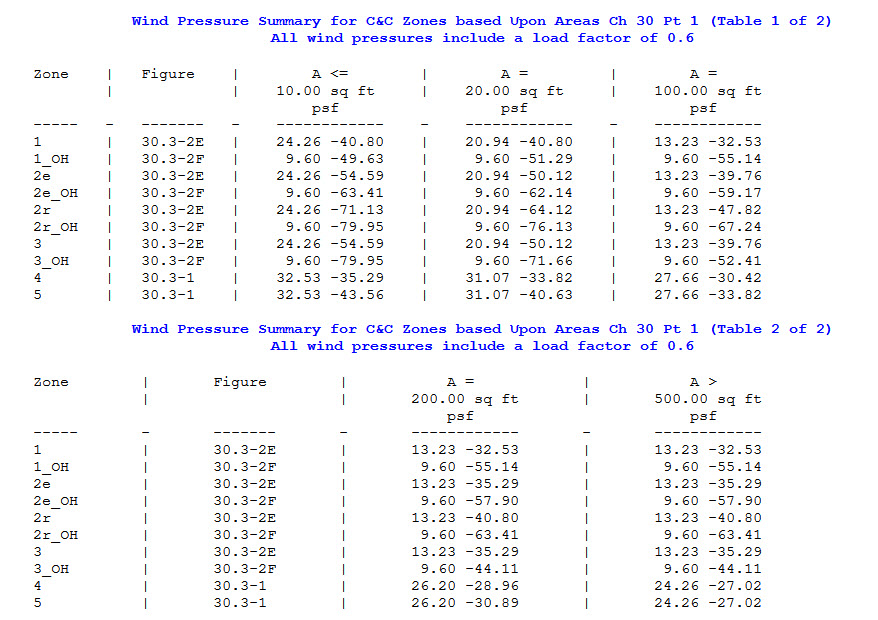
To the right is the C&C Zone Summary for this building. In one table, we have max and min pressures for all possible C&C areas and zones. This was created by clicking 2 checkboxes.
How is Summary Created?
Let’s illustrate how the table is created using the same building stated previously. We are using Ch 30 Part 1, and so we are followign Fig 30.3-1 for the walls. Since it’s a Hipped roof with a slope of 18.4 deg, Fig 30.3-2E would be used for the roof and 30.3-2F for the overhang. Our h/B = 0.48, and so we are using the h/B<=0.5 for both Fig 30.3-2E and F. Looking at all three of these figures, we determine the Effective Area’s where each curve changes the value of GCp and we summarize them in the table below. The “Unique Areas” is the combination of unique areas from all three figures.
| Fig 30.3-1 | Fig 30.3-2E | Fig 30.3-2F | Unique Areas |
| 10 | 10 | 10 | 10 |
| 20 | 20 | ||
| 100 | 100 | 100 | |
| 200 | 200 | 200 | |
| 500 | 500 |
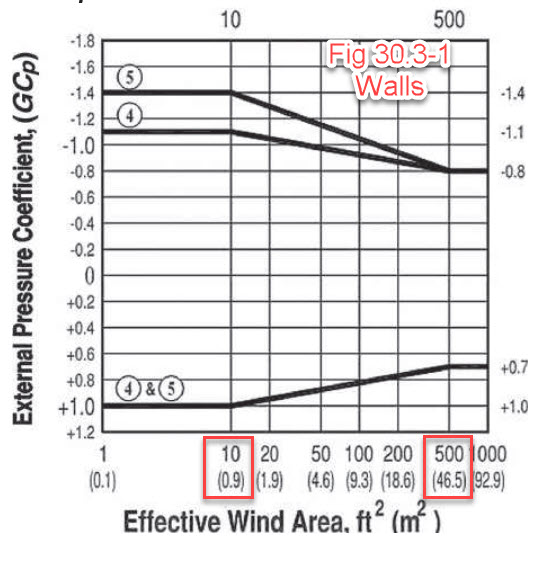
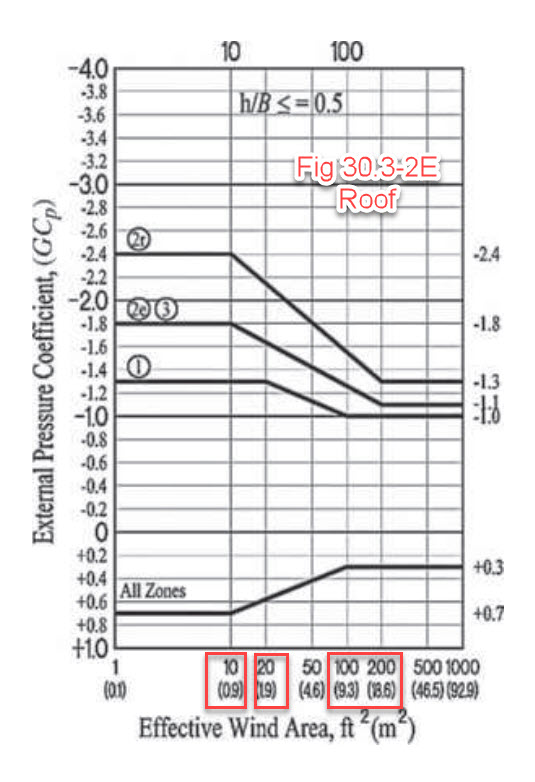
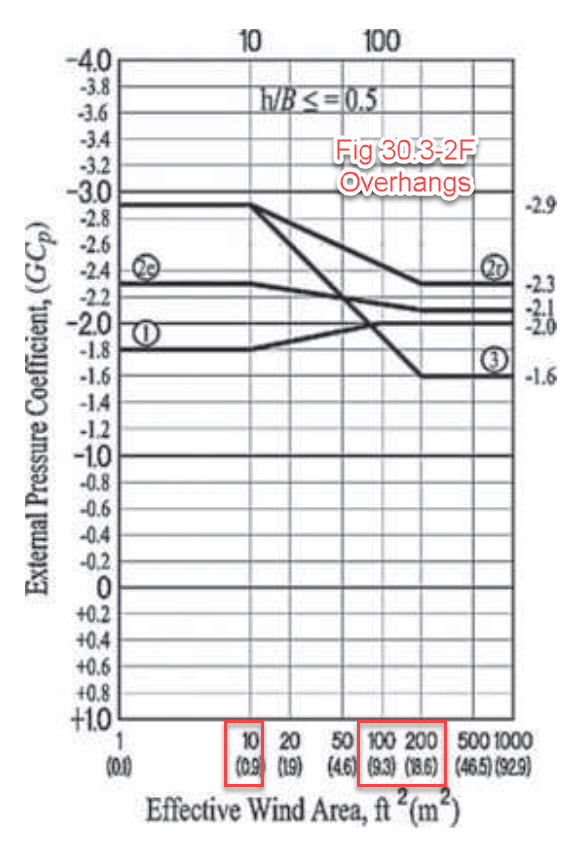
These “Unique Areas” are the exact same values that appeared in the C&C Summary chart, we display the pressures for each of these Unique Areas for EACH zone.
Two (2) pressures are listed for each cell, these represent the maximum and minimum pressure calcualted. The ASCE 7 convention is that Positive pressures are acting toward the surface and negative pressures are acting away from the surface.
The first column is <= 10 sq ft, which means that any area that is less than this value use this column of pressures.
The last columnn is > 500 sq ft, which means that any area that is > 500 sq ft will use the values in the columns.
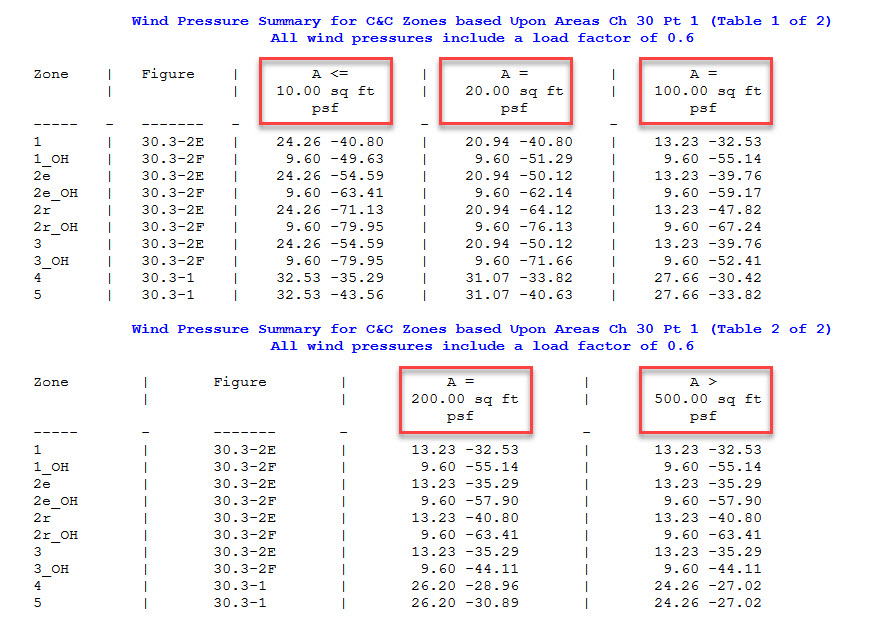
For all values that fall between the first and last column things get a little more complicated. The Figures are not linear, they are linear on the vertical scale and logarithmic on the horizontal. There are a couple options depending upon how accurate you wish to be in your calculations:
1) Simple – If you have an area that falls between two columns, then just take the pressures that are the highest. This will always be the one to the left, which has a lower area.
2) Accurate – If you want to interpolate then you must use Logarithm for the Area values. For example, if we want to get Zone 4 value at 100 sq ft, we would calcualte as follows (Using A = 10 sq ft and 500 sq ft as upper and lower bounds):
Zone 4 @ 500 sq ft ==> Pu=24.26, Au = 500
Zone 4 @ 10 sq ft ==> Pl=32.53, Al = 10
What is Px for Zone 4 @ 100 sq ft?
Px = [(Pu-Pl) / (Ln(Au)-Ln(Al) ]*(Ln(Ax)-Ln(Al)) + Pl
Px = [(24.26-32.53)/(Ln(500)-Ln(10))]*(Ln(100)-Ln(10))+32.53 = 27.66 psf
Which exactly agrees with the value that was shown in our table.
3) Approximate – The above interpolation is a little complicated, what if we just used linear interpolation?
Px = [(Pu-Pl) / (Au-Al)]*(Ax-Al) + Pl
Px = [(24.26-32.53)/(500-10)]*(100-10)+32.53 = 31.0 psf
It’s not very accurate, but at least it’s conservative.
Don’t Forget the One-Third Rule:
When calculating your effective areas, don’t forgot to consider the definition of the Effective area, which includes what we refer to as the One-Third rule. When you enter the dimensions into MecaWind this is taken into account by the software automatically; however, if you choose instead to use the C&C summary table, then you must take this into consideration with any area that you use to extract values from the C&C Summary manually. As a reminder the One-Third Rule is stated below.
The effective area is the span length multiplied by an effective width that need not be less than one-third the span length.
Conclusion
The C&C Summary is a very easy way to get pressures across all zones and all areas with just two clicks. We explained above how the data is generated, and how you can interpret the data. When you have an area betwen two columns, it’s simplest to just take the higher pressures and be conservative. I have demonstrated one summary table here, and all of the other summary tables follow the same basic approach.
